在 PHP 中绘制图形
大家好,今天本人给大家带来文章《在 PHP 中绘制图形》,文中内容主要涉及到,如果你对文章方面的知识点感兴趣,那就请各位朋友继续看下去吧~希望能真正帮到你们,谢谢!
本文介绍了如何在 PHP 中使用 pChart 创建图形。第一个是条形图,第二个是样条图,最后一个是来自 Mysql 的直方图。
设置你的环境
在使用 pChart 之前,你首先需要安装 php5。你可以从 SourceForge 获得 PHP5 作为 XAMPP 5.5.28 的一部分。
当你有 XAMPP 5.5.28 时,从他们的官方网站下载 pChart。之后,将 pChart 提取到 XAMPP 5.5.28 的 htdocs 文件夹中。
打开 pChart 文件夹,其结构应如下图所示:

注意:
-
class文件夹包含我们将使用的类定义。 -
fonts文件夹包含我们可以在图表中使用的字体文件。
完成 pChart 设置后,你现在可以开始绘图了。
在 PHP 中使用 pChart 绘制条形图
使用 pChart 绘制条形图的 PHP 代码必须包含 class 文件夹中的三个文件。这些文件是:
-
pData.class.php -
pImage.class.php -
pDraw.class.php
在这些文件中,pData.class.php 允许你加载将在图表中使用的数据。你需要 pDraw.class.php 来绘制图表。
接下来,pImage.class.php 将让你在 WEB 浏览器中呈现图表。你必须使用 PHP required_once() 包含这些文件。
你可以使用相对路径包含它们或定义一个 PCART_PATH 常量。然后使用 set_include_path(),你可以为 pChart 类使用短目录名称。
话虽如此,我们可以使用以下步骤创建带有 pChart 的条形图:
-
定义
PCART_PATH常量。 -
使用
set_include_path()作为pChart类的短目录名称。 -
使用
required_once()包含pChart类。 -
创建一个新的
pData对象。 - 创建你的数据或将其导入。
-
使用
addPoints方法将数据添加到pData对象。 -
使用
pImage对象为图表创建图像。 - 设置图表的字体。
-
使用
pData的setGraphArea方法设置图形区域。 -
使用
pData的drawScale和drawBarChart方法绘制刻度和条形图。 - 发送标头信息以告诉浏览器你正在发送图像。
-
使用
pData的Render方法渲染图像。确保将null传递给Render方法。
以下是这些步骤的实现。以下是 Firefox 101.0 中的输出图像。
addPoints($sample_data_set);
// Create the pChart Image. The first two argument
// to the pImage object are the width and height
// of the rendered chart.
$pchart_image = new pImage(500, 300, $pchart_data);
// Set the font.
$pchart_image->setFontProperties(
["FontName" => PCHART_PATH . "/fonts/ForGotte.ttf",
"FontSize" => 16]
);
// Define the graph area. The first two arguments
// are the x-coordinates. While the last two are
// the y-coordinates.
$pchart_image->setGraphArea(35, 25, 475, 275);
$pchart_image->drawScale();
$pchart_image->drawBarChart();
// Render the chart as a PNG image
header("Content-Type: image/png");
$pchart_image->Render(null);
?>
输出:

在 PHP 中使用 pChart 绘制样条图
绘制样条图的过程与绘制条形图的过程相同,不同之处在于你使用 drawSplineChart 方法绘制样条图。此外,你可以选择不将图表作为图像发送。
相反,你可以选择 pData 的 Stroke 方法在 Web 浏览器中呈现图表。
以下代码使用 pChart 绘制样条图。此外,我们使用的是 fonts 目录中的 MankSans.ttf 字体。
addPoints([4,2,1,4]);
// Create the pChart Image. The first two argument
// to the pImage object are the width and height
// of the rendered chart.
$pchart_image = new pImage(700, 220, $pchart_data);
// Set the font.
$pchart_image->setFontProperties(
["FontName" => PCHART_PATH . "/fonts/MankSans.ttf",
"FontSize"=> 18]
);
// Define the graph area. The first two arguments
// are the x-coordinates. While the last two are
// the y-coordinates.
$pchart_image->setGraphArea(60, 40, 670, 190);
$pchart_image->drawScale();
$pchart_image->drawSplineChart();
// Draw the chart as a stroke.
$pchart_image->Stroke();
?>
输出:
在 PHP 中从 mysql 数据库中绘制柱状图
绘制直方图遵循与条形图和样条图类似的步骤。但是,有一些差异值得指出。
首先,直方图的数据将来自 Mysql。这意味着你应该有一个包含一些示例数据的数据库。
其次,你将使用表列名称作为直方图上的轴。为此,你将使用一些 pData 方法,例如 setAbscissa、setSeriesOnAxis 和 setAxisName。
现在,创建一个名为 weather_measurements 的数据库,然后使用以下命令创建一个表:
CREATE TABLE measures (
timestamp INT NOT NULL DEFAULT '0',
temperature INT NOT NULL,
humidity INT NOT NULL
)
使用以下命令将样本数据插入 measures 表中:
INSERT INTO measures (timestamp, temperature, humidity) VALUES (UNIX_TIMESTAMP(), 20, 50);
INSERT INTO measures (timestamp, temperature, humidity) VALUES (UNIX_TIMESTAMP(), 18, 44);
INSERT INTO measures (timestamp, temperature, humidity) VALUES (UNIX_TIMESTAMP(), 19, 70);
确保样本数据在数据库中,然后使用以下命令创建直方图:
addPoints($timestamp,"Timestamp");
$pchart_data->addPoints($temperature,"Temperature");
$pchart_data->addPoints($humidity,"Humidity");
// Put the table column on the appropriate axis
$pchart_data->setAbscissa("Timestamp");
$pchart_data->setSerieOnAxis("Humidity", 1);
$pchart_data->setXAxisName("Time");
$pchart_data->setXAxisDisplay(AXIS_FORMAT_TIME,"H:i");
// Dedicate the first and second axis to
// Temperature and Humidity.
$pchart_data->setAxisName(0, "Temperature");
$pchart_data->setAxisUnit(0, "°C");
$pchart_data->setAxisName(1, "Humidity");
$pchart_data->setAxisUnit(0, "%");
// Create the pChart Image. The first two argument
// to the pImage object are the width and height
// of the rendered chart.
$pchart_image = new pImage(500, 300, $pchart_data);
// Set the font.
$pchart_image->setFontProperties(
["FontName" => PCHART_PATH . "/fonts/verdana.ttf",
"FontSize"=> 11]
);
// Set the graph area.
$pchart_image->setGraphArea(55,25, 475,275);
$pchart_image->drawScale();
$pchart_image->drawBarChart();
// Draw the chart as a stroke.
$pchart_image->Stroke();
?>
输出(你的时间会有所不同):
文中关于PHP编程,后端开发的知识介绍,希望对你的学习有所帮助!若是受益匪浅,那就动动鼠标收藏这篇《在 PHP 中绘制图形》文章吧,也可关注golang学习网公众号了解相关技术文章。
 使 marsha 从字符串中失败
- 上一篇
- 使 marsha 从字符串中失败

- 下一篇
- 怎么使用PHP和Linux搭建一个服务器
-
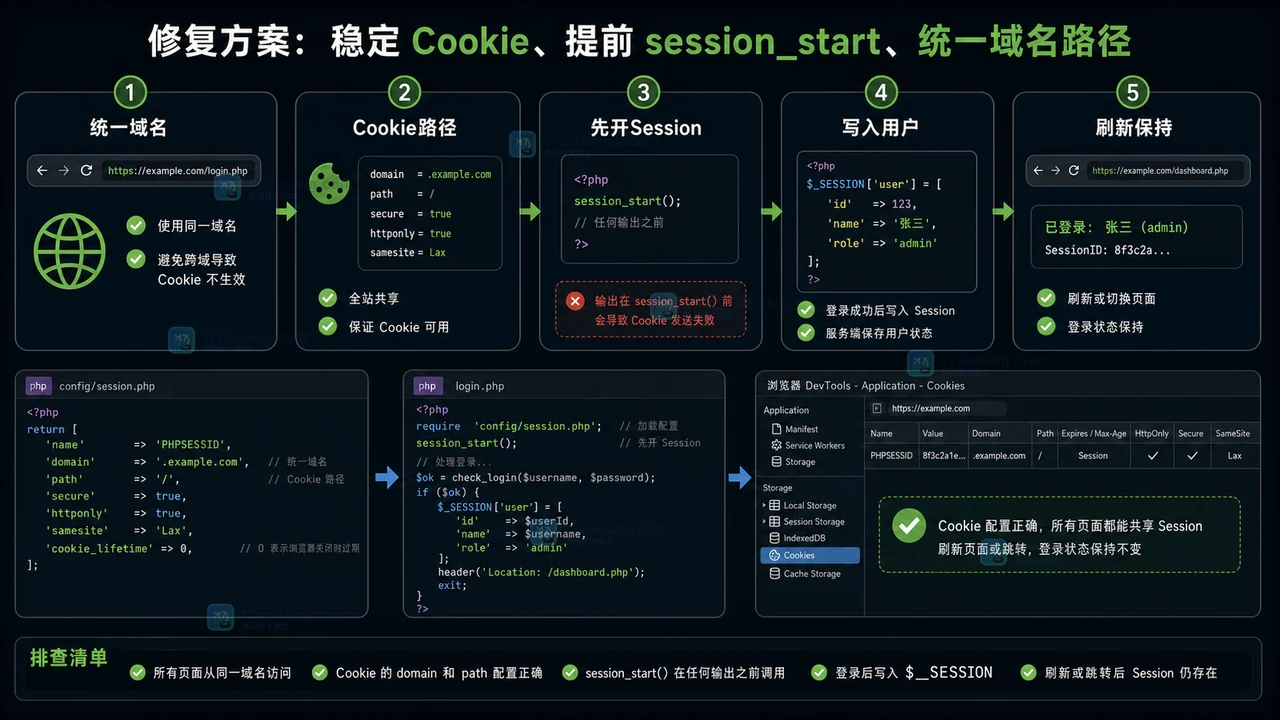
- 文章 · php教程 | 3天前 | WEB开发 · 登录状态 · Cookie · PHP · session · session_start · php cookie session session_start PHPSESSID 登录态丢失
- PHP Session 登录态突然丢失怎么办:从 Cookie 到 session_start 一步步排查
- 196浏览 收藏
-
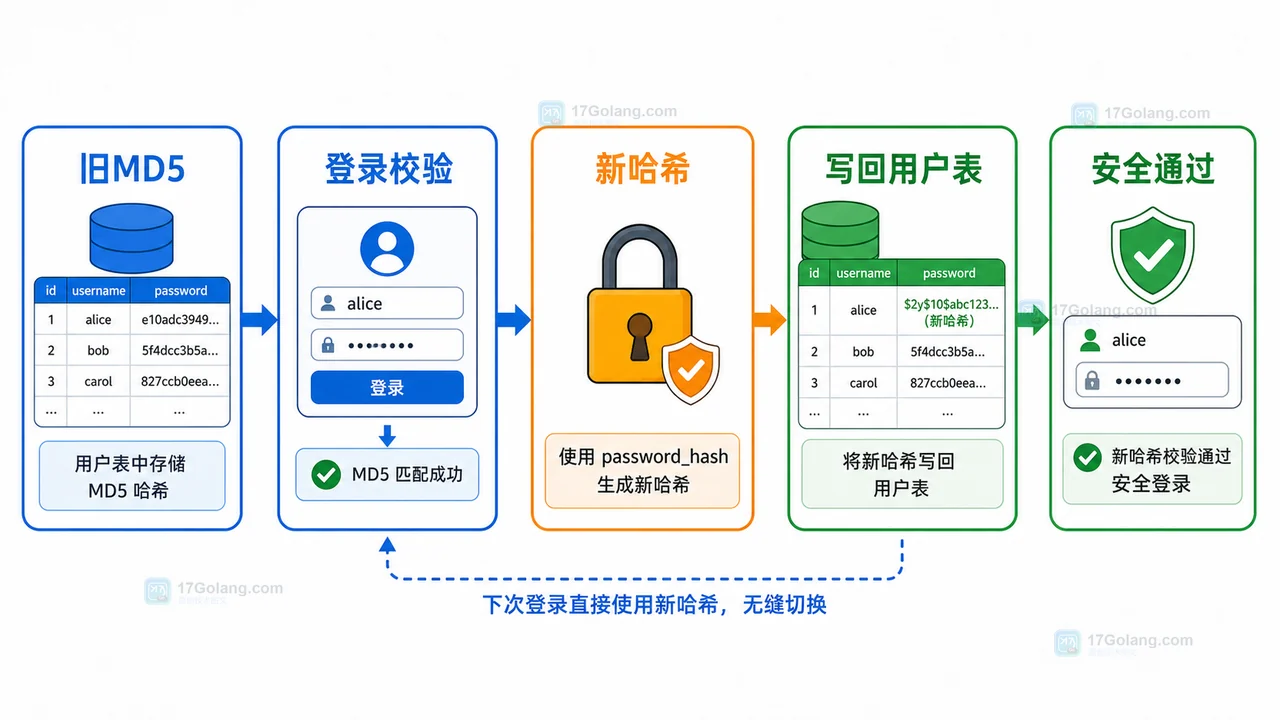
- 文章 · php教程 | 4天前 | PHP · MD5 · 登录安全 · password_hash · password_verify · password_hash password_verify 登录安全 PHP密码迁移 MD5迁移
- PHP 旧 MD5 密码如何平滑迁移到 password_hash:兼容登录与自动升级完整流程
- 174浏览 收藏
-

- 前端进阶之JavaScript设计模式
- 设计模式是开发人员在软件开发过程中面临一般问题时的解决方案,代表了最佳的实践。本课程的主打内容包括JS常见设计模式以及具体应用场景,打造一站式知识长龙服务,适合有JS基础的同学学习。
- 543次学习
-

- GO语言核心编程课程
- 本课程采用真实案例,全面具体可落地,从理论到实践,一步一步将GO核心编程技术、编程思想、底层实现融会贯通,使学习者贴近时代脉搏,做IT互联网时代的弄潮儿。
- 516次学习
-

- 简单聊聊mysql8与网络通信
- 如有问题加微信:Le-studyg;在课程中,我们将首先介绍MySQL8的新特性,包括性能优化、安全增强、新数据类型等,帮助学生快速熟悉MySQL8的最新功能。接着,我们将深入解析MySQL的网络通信机制,包括协议、连接管理、数据传输等,让
- 500次学习
-

- JavaScript正则表达式基础与实战
- 在任何一门编程语言中,正则表达式,都是一项重要的知识,它提供了高效的字符串匹配与捕获机制,可以极大的简化程序设计。
- 487次学习
-

- 从零制作响应式网站—Grid布局
- 本系列教程将展示从零制作一个假想的网络科技公司官网,分为导航,轮播,关于我们,成功案例,服务流程,团队介绍,数据部分,公司动态,底部信息等内容区块。网站整体采用CSSGrid布局,支持响应式,有流畅过渡和展现动画。
- 485次学习
-

- ljg-skills
- ljg-skills 是李继刚开源的 AI 技能与提示词集合,面向大模型使用者整理了一批可复用的 prompt、角色设定和任务技能模板,适合用于学习提示词设计、搭建个人 AI 工作流和沉淀团队常用智能体能力。
- 1022次使用
-

- MELO音乐
- MELO音乐是一站式AI视频与音乐制作助手,对标suno, udio的高品质体验。提供伴奏生成、原创写词、无损导出、哼唱识曲、混音变声等全套音频与短视频编辑工具。无论是流行Kpop、电音说唱、民谣古风、摇滚儿歌还是商用轻音乐,MELO为你免费谱曲,轻松做同款!
- 982次使用
-

- UniScribe
- UniScribe 是一款 AI 音视频转文字与内容整理工具,支持上传音频、视频文件或粘贴 YouTube 链接,自动生成转写文本、摘要、思维导图和关键问题,并支持多格式导出,适合会议记录、课程学习、访谈整理和内容创作复盘。
- 922次使用
-

- 剧云
- 剧云是专业中文剧本创作平台,安全稳定运行十余年,集成AI编剧、剧本医生审核、人物小传、剧情关系图、大纲编写、多人协作、Word导入导出、版权管控功能,数据安全防护,轻松高效创作剧本。
- 1107次使用
-

- 万象有声
- 万象有声,一个专为有声创作者打造的新一代智能有声内容创作平台。平台提供专业的智能拆章、智能画本编辑、AI配音、AI生成音效、后期制作、智能对轨、智能审听等有声创作全流程工具,可以帮助创作者高效、低成本创作出引人入胜的有声作品。立即体验,让有声书制作更简单!
- 1091次使用
-
- PHP技术的高薪回报与发展前景
- 2023-10-08 501浏览
-
- 基于 PHP 的商场优惠券系统开发中的常见问题解决方案
- 2023-10-05 501浏览
-
- 如何使用PHP开发简单的在线支付功能
- 2023-09-27 501浏览
-
- PHP消息队列开发指南:实现分布式缓存刷新器
- 2023-09-30 501浏览
-
- 如何在PHP微服务中实现分布式任务分配和调度
- 2023-10-04 501浏览